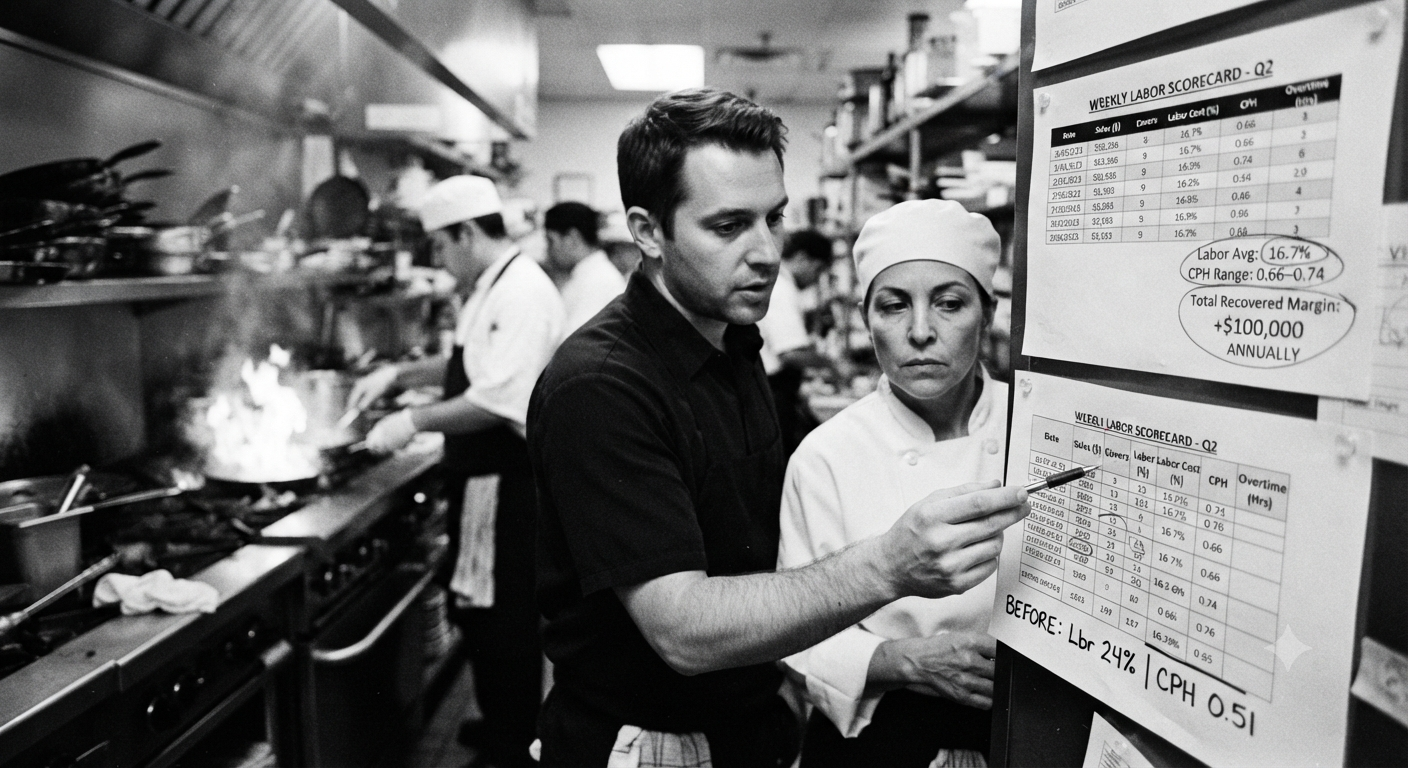
Labor from 22% to 16.7% in 4 weeks (without slashing the schedule)
“Sales look good on paper. My team is slammed. But the bank account doesn’t move.”
They were doing between $22,000 and $53,000 per week in sales from late April through June. On the floor, it felt busy. On paper, the numbers told a different story:
- Average labor %: just under 22%
- Labor % range: 21.44% to 24.37%
- Covers: 223–449
- CPHL (covers per labor hour): hovering around 0.51–0.59
Translation: plenty of motion, not a lot of money left over.
What changed
Instead of cutting staff or praying for more covers, we worked with them to tighten how they used the people they already had:
- Got honest about the baseline
We pulled 6 weeks of data and made one simple weekly scoreboard: sales, labor dollars, labor %, CPHL.
- Attacked overtime and “dead” hours first
OT hours went from as high as 62 hours in a week to 0 in some weeks. We shifted labor out of slow dayparts and into peak windows instead of just “staffing for vibes.”
- Aligned schedule to actual demand
Using covers and CPHL, we rebalanced shifts so they weren’t paying the same number of people to stand around during soft periods.
The results (4 weeks)
- Average labor % dropped to ~16.7%
- Productivity jumped
- CPHL climbed to 0.66–0.74 vs 0.51–0.59 before(a 40+ % improvement)
- On roughly $40,000+ per week in sales, that 5.3‑point labor swing is worth about $2,000 per week in financial opportunity.
- That is ~$100,000+ per year back into the business without adding a single cover or slashing the schedule.
Same restaurant. Same footprint. Same team. Different math.
What this means for you
If your weekly labor % is sitting in the low 20s or higher, you might be one scheduling pass away from a similar shift.
This client didn’t:
- Slash hours across the board
- Blow up their menu
- Jack up prices
They simply:
- Measured labor % and CPHL weekly
- Killed unnecessary OT and low‑productivity hours
- Matched bodies to demand instead of habit
Want to see your own version of this chart?
If you want to know what a 2–5 point labor swing would look like in your restaurant:
Hit reply with “SNAPSHOT” or grab a spot here: [booking link].
We’ll plug in your last 4–8 weeks of sales and labor, show you exactly what each labor point is worth in dollars, and outline 1–2 shifts you can test in the next pay period.
No pitch on that call. If you want help executing after you see the numbers, we can talk.